Cost per lead is the number that appears first in every LinkedIn campaign report. It’s also the number that causes most universities to misread their LinkedIn performance — and to make decisions based on the wrong signal.
A LinkedIn lead costs more than a Google lead. That’s typically true. What’s also typically true is that a LinkedIn lead for a PG admissions campaign converts to a counsellor-qualified prospect at a higher rate, converts to an application at a higher rate, and converts to an enrolled student at a higher rate. When the measurement stops at CPL, the channel looks expensive. When the measurement runs through to enrolment, the picture is usually very different.
What follows is a framework for measuring LinkedIn Ad ROI across the full admissions funnel — not just to the form submission, but through to the outcomes that actually matter.
Why CPL alone is a bad metric for LinkedIn
CPL is a ratio: total ad spend divided by total form submissions. It measures how cheaply traffic converted to a form fill. It says nothing about whether the person who filled the form was the right audience, whether they were genuinely interested, or whether they ever spoke to a counsellor.
In a context where all leads are roughly equivalent in quality, CPL is a reasonable efficiency proxy. In university admissions, leads are not equivalent. A form submission from a 17-year-old who clicked an ad while procrastinating is not worth the same as a form submission from a 28-year-old IT manager who read the programme page and then filled a Lead Gen Form with accurate profile data.
LinkedIn Ads produce the second type of lead at a higher rate than Google or Meta, for the reasons covered in detail in Why LinkedIn Ads work better than Google Ads for Master’s programme admissions. But because the CPL is also higher, comparing channels by CPL alone makes LinkedIn look like the wrong choice — when on a cost-per-enrolled-student basis, it often isn’t.
The framework below tracks what actually matters.
The metrics that matter across the admissions funnel
The first metric is cost per counsellor-qualified lead (CPQL). A counsellor-qualified lead is one where, after the counsellor speaks to the prospect, they confirm the person is genuinely interested, meets basic eligibility, and is in a realistic position to enroll. Not every form submission reaches this bar. The ratio of form submissions to qualified leads is the first real quality signal.
To calculate CPQL: total LinkedIn spend divided by the number of counsellor-qualified leads from LinkedIn in the same period.
If LinkedIn generates 100 form submissions at a CPL of ₹900 (total spend ₹90,000) and 55 of those become counsellor-qualified leads, the CPQL is ₹1,636. If Google generates 200 submissions at a CPL of ₹400 (total spend ₹80,000) but only 30 are qualified, the CPQL is ₹2,666. LinkedIn looks expensive at CPL. At CPQL, it’s cheaper.
Tracking this requires the counsellor team to log the source (LinkedIn vs Google vs other) and the qualification outcome for each lead. Two extra fields, captured consistently.
The second metric is cost per application (CPA). An application means the prospect has moved from interested to committed — actually filling out the programme application form. Many people inquire; fewer apply. CPA measures spend per channel at this stage, calculated the same way as CPQL but one step further down the funnel. This is where LinkedIn’s professional audience tends to show its clearest advantage, because a higher proportion of its leads make it to application.
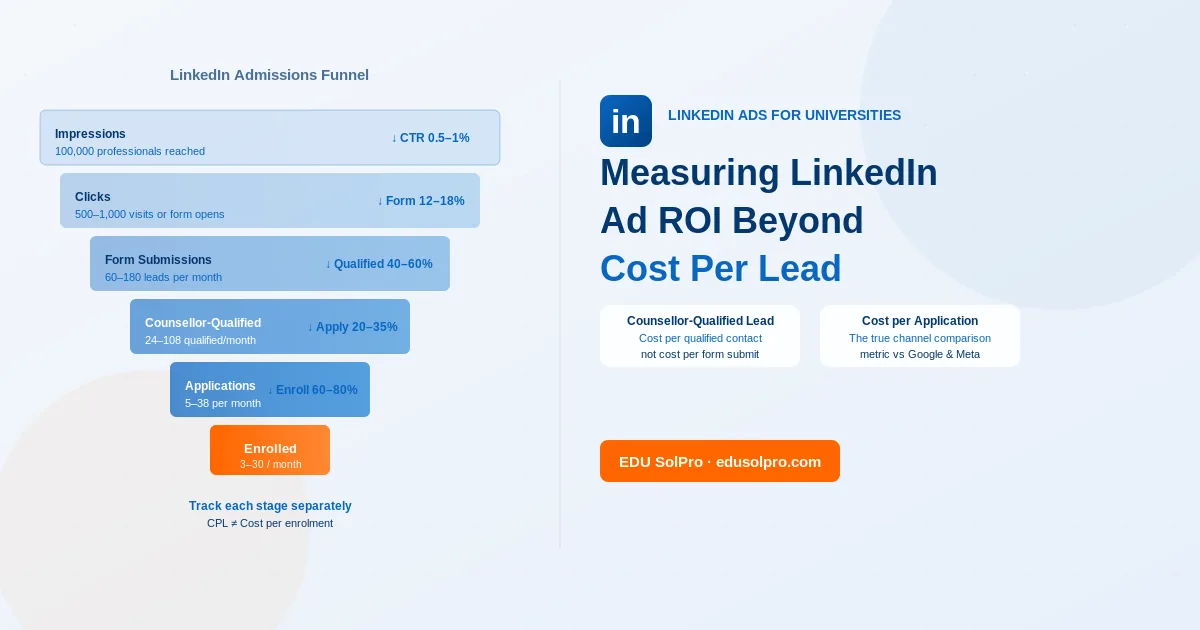
Third is conversion rate at each funnel stage. The stages for a LinkedIn PG admissions campaign are: impressions to clicks (CTR), clicks to form submissions, form submissions to counsellor-qualified leads, qualified leads to applications, applications to enrolments. Each rate can degrade for different reasons. Low CTR is a creative or targeting problem. Low form completion is a friction or offer problem. Low qualification rate is an audience mismatch. Low application rate after qualification is a counsellor follow-up or expectation-setting problem. Tracking each stage separately shows which step to actually fix.
Fourth is cost per enrolled student. Total LinkedIn spend over a cycle divided by the number of enrolled students who cited LinkedIn as their first or primary touchpoint. This connects marketing spend to revenue and is the number that matters most to institutional leadership. Getting it requires the admissions team to log first-touch source at enrolment — a process step, not a tech upgrade.
Fifth, for universities that want a single composite number: quality-adjusted lead value. Assign each lead an expected value based on conversion probability through each funnel stage. If a LinkedIn lead converts to application at 25% and an application to enrolment at 70%, the expected probability of becoming an enrolled student is 17.5%. If average programme fee is ₹3 lakh with 30% contribution margin, each LinkedIn lead has an expected contribution of ₹15,750. A ₹1,200 CPL is not expensive at that return. This framing doesn’t change campaign mechanics, but it changes how the marketing team defends LinkedIn investment in budget conversations.
What to track and how to build the attribution system
Measuring LinkedIn ROI properly requires three things that most universities don’t currently have in place.
UTM parameters on every LinkedIn ad. These tags identify source (LinkedIn), medium (paid-social), campaign name, and ad set. When a user clicks through to the university website, the tags are captured in Google Analytics and allow website behaviour and form submissions to be attributed to specific LinkedIn campaigns. For Lead Gen Forms, UTM attribution to website sessions doesn’t apply because the form is completed inside the LinkedIn app. Lead source is attributed by the Lead Gen Form identifier itself — the form name should include the campaign and programme so leads self-identify in the CRM.
A CRM field for lead source, populated at entry. Every lead that enters the CRM needs a source field populated at the point of entry, not filled in retrospectively by counsellors. Retrospective entry is inconsistent. The field should populate automatically from UTM data for website-sourced leads and from the Lead Gen Form identifier for LinkedIn leads.
Admissions outcome tracked back to the original source. When a student enrolls, the CRM record needs to include the lead source from the first touchpoint. This is the step that closes the loop between spend and enrolled student, and it’s the step most universities skip entirely. Without it, cost per enrolled student can’t be calculated and the channel comparison stays stuck at CPL.
LinkedIn-specific metrics to monitor inside Campaign Manager
Beyond the funnel metrics that track LinkedIn performance against other channels, Campaign Manager provides campaign-internal metrics worth monitoring.
Lead Gen Form completion rate. This is the percentage of people who opened a Lead Gen Form and submitted it. A healthy completion rate for PG admissions campaigns is 10 to 20%. Below 8% typically indicates either the form has too many manual questions, the offer isn’t compelling enough, or the audience is being reached at the wrong time (e.g., through Message Ads sent to cold audiences without prior engagement).
Click-through rate (CTR). For Sponsored Content, a CTR of 0.4 to 0.8% is typical for PG admissions creative targeting a defined professional audience. Above 1% usually means the creative is exceptionally well-targeted. Below 0.3% suggests the creative or audience match needs work.
Audience segment performance. Campaign Manager allows breaking down performance by audience segment — industry, job function, seniority, company size. This shows which segment of the target audience is engaging and converting at the highest rate, which informs both immediate creative decisions and longer-term audience strategy.
Frequency. LinkedIn shows the average number of times each member in the audience has seen the ad. For PG admissions campaigns, a frequency above 5 to 6 within 30 days typically means the audience has been saturated — the same people are seeing the same ad repeatedly without acting. When frequency climbs, the options are to refresh the creative, expand the audience, or reduce the budget until the admissions season produces a new wave of decision-making activity.
Building a reporting cadence that connects spend to outcomes
Monthly reporting that only shows Campaign Manager metrics — impressions, clicks, CPL — is reporting on inputs, not outcomes. A more useful reporting cadence separates inputs from outputs.
Campaign-level report (weekly): CTR, Lead Gen Form completion rate, total form submissions, CPL, total spend. This tells the campaign manager whether the ads are working mechanically.
Funnel report (monthly): Total LinkedIn leads, counsellor-qualified rate, total qualified leads, CPQL, applications sourced from LinkedIn, CPA. This tells the admissions leadership whether LinkedIn is producing the right audience.
Cycle-end report (per admissions season): Total LinkedIn spend, enrolled students attributed to LinkedIn, cost per enrolled student. This tells the institution what LinkedIn produced relative to the investment.
The weekly report is operational. The monthly report is directional. The cycle-end report is the one that answers whether LinkedIn should be part of next year’s plan.
When LinkedIn is producing good ROI and when it isn’t
LinkedIn isn’t always the right investment for every programme or every university. The measurement framework above will show when it’s working — but it’s worth knowing what working and not working look like in practice.
LinkedIn is producing good ROI when: the counsellor-qualified rate on LinkedIn leads is meaningfully higher than on Google or Meta leads, the cost per application is competitive with other channels over a 90-day period, and counsellors report that LinkedIn leads are more informed about the programme than leads from other channels (because the professional context raises the quality of the initial engagement).
LinkedIn is not working when: LinkedIn leads produce a qualified rate similar to or worse than cheaper channels, the campaign has been running for 90 days without finding a segment that converts, or the counsellor team reports that LinkedIn leads are difficult to contact or unresponsive to follow-up (which can indicate audience mismatch — the targeting is reaching professionals who don’t have the decision-making headspace to follow through).
The measurement framework doesn’t just tell you what LinkedIn costs. It tells you whether LinkedIn is the right channel for the programme at hand.
Connecting ROI measurement to budget decisions
The practical output of this measurement framework is better budget allocation decisions. Specifically:
If LinkedIn cost per enrolled student is lower than Google, the budget should shift toward LinkedIn. If it’s higher, the question is whether the LinkedIn audience quality is producing other benefits — longer-term brand recognition among relevant professionals, a pipeline of future applicants who aren’t yet ready to apply — that justify the higher cost. Sometimes it does. Sometimes it’s just expensive.
For universities new to LinkedIn Ads, the measurement infrastructure is worth building before the campaign launches, not after. Setting up CRM lead source tracking, UTM parameters, and the counsellor qualification logging process before the first lead arrives means the data is clean from day one.
Our post on LinkedIn Ads for MBA and Master’s admissions in India covers what campaigns look like in practice across different programme types. For the targeting that determines lead quality before any measurement begins, our guide on targeting the right audience for PG admissions on LinkedIn covers audience construction in detail.
For a worked example of how this measurement framework applies to a real campaign, the CEPT University LinkedIn Ads case study shows how results were tracked across seven specialist Master’s programmes in the 2026 admissions cycle.
Our LinkedIn Ads service for universities includes measurement setup alongside campaign management: UTM structure, CRM integration, and the reporting framework that connects LinkedIn spend to enrolled students.
Frequently Asked Questions
Can LinkedIn Ads ROI be measured without a CRM? It can be approximated. Without a CRM that tracks lead source through to enrolment, the university can manually ask enrolled students where they first heard about the programme (via the admissions interview or enrolment form) and cross-reference with campaign records. This is less reliable than automated CRM tracking but better than nothing. A spreadsheet that tracks each LinkedIn lead from submission through to application and enrolment outcome, updated by the counsellor team, produces usable data if maintained consistently.
How long should a LinkedIn campaign run before evaluating ROI? The campaign-internal metrics (CTR, completion rate, CPL) can be evaluated meaningfully after 30 days. The funnel metrics (CPQL, CPA) require 60 to 90 days to accumulate enough lead volume for reliable patterns. Cost per enrolled student requires a full admissions cycle. Evaluating LinkedIn ROI comprehensively at 30 days is like evaluating a marketing strategy at the top of the funnel and calling it complete.
What happens to ROI if the counsellor follow-up is slow? It deteriorates significantly. A LinkedIn lead that doesn’t receive follow-up within 2 to 4 hours of submission is substantially more likely to engage with a competing institution’s admissions process in the interim. Slow follow-up is a common reason LinkedIn campaigns appear to underperform — the leads are qualified, but the conversion from lead to application is lost in the follow-up gap rather than in the channel itself.
Is it worth paying for LinkedIn’s company engagement reports? LinkedIn’s Conversions API and company engagement reporting are worth exploring for universities that want deeper attribution data. The Conversions API, in particular, allows reporting form submissions from Lead Gen Forms back to LinkedIn as conversion events, which improves LinkedIn’s own optimisation — the algorithm can optimise for submissions rather than just clicks. For campaigns generating more than 50 leads per month, this is worth the setup effort.
How do you separate LinkedIn-influenced from LinkedIn-sourced enrolments? Some enrolled students will have seen a LinkedIn ad as one of several touchpoints before applying, without LinkedIn being their first or only touchpoint. Multi-touch attribution models that give partial credit to each channel a student interacted with are the most accurate, but require analytics infrastructure that most universities don’t have. As a practical alternative, tracking “first touch” (the first channel a student interacted with) alongside “last touch” (the channel immediately before application) gives a reasonable bracket. Students where LinkedIn is the first touch and where LinkedIn is in the path are both worth counting in different ways.