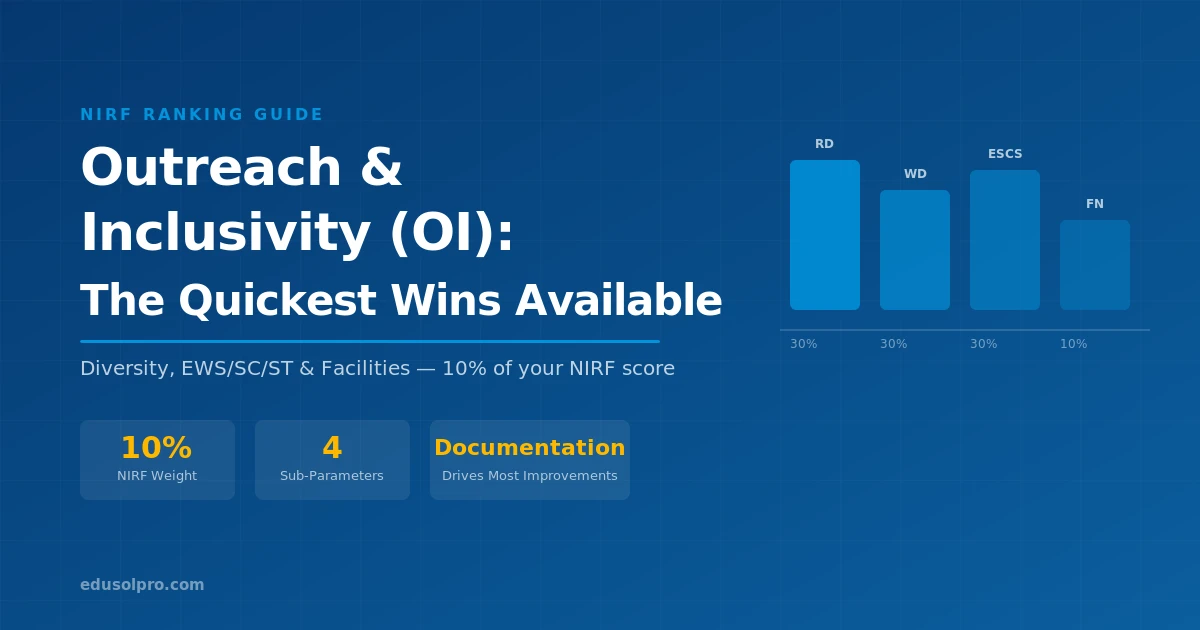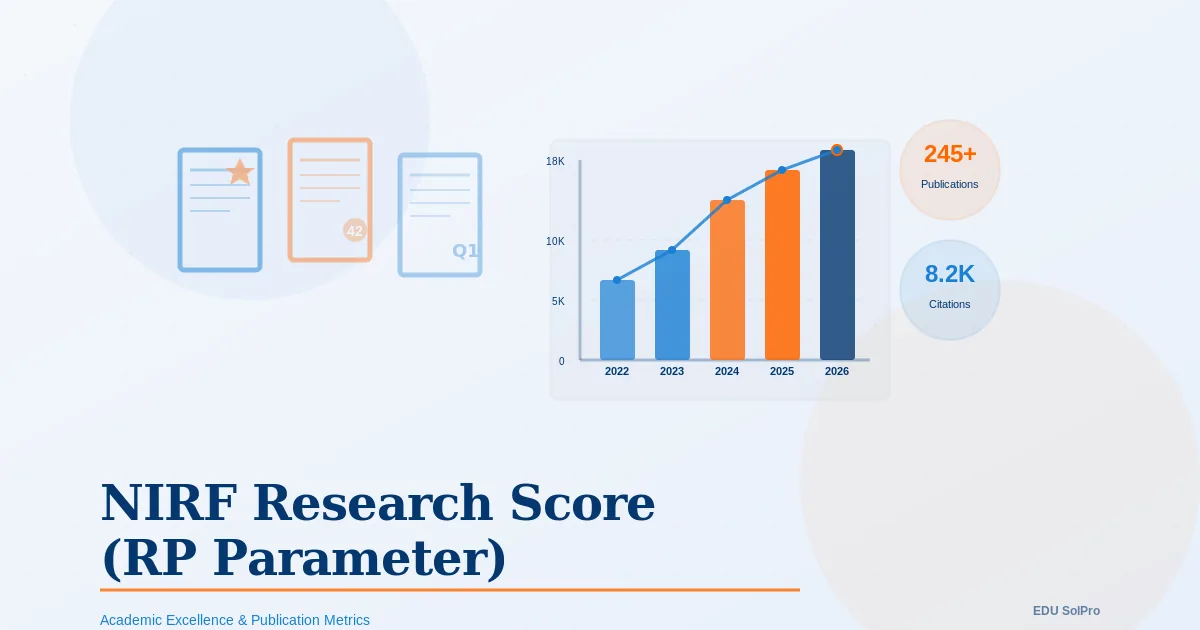
The Research and Professional Practice (RP) parameter is 30% of your NIRF score, the single largest component. Most universities leave 8-15 points on the table here because they don’t understand what gets counted or how it gets weighted.
RP doesn’t measure research quality by traditional metrics like prestige or peer review. It measures what can be counted: publications in Scopus and Web of Science, patents, funded projects with documented funding amounts, and consultancy services billed to external clients. This creates a gap. Universities doing excellent research but poor documentation score lower than universities with adequate research and tight tracking systems.
This article breaks down exactly how RP is calculated, shows where institutions commonly fall short, and gives you six tactics to improve your score in the next NIRF cycle.
How the NIRF RP parameter is structured
The RP parameter is built on four sub-metrics:
-
Publications Unweighted (PU) - 35 points: Total count of research publications indexed in Scopus or Web of Science published in the previous three years. This is pure volume.
-
Quality of Publications (QP) - 35 points: Citation impact of your publications. NIRF uses citations per paper, h-index, and highly cited papers (papers in the top 10% by citations in their field). This rewards quality, not just quantity.
-
Intellectual Property Rights (IPR) - 15 points: Patents published and granted. This includes filed patents, published patents, and licensed patents.
-
Footprint of Projects, Professional Practice, and Executive Development Programs (FPPP) - 15 points: Funded research projects from government or private sources, consultancy revenue, and fees from professional development programs. This is where most private universities completely miss points.
The total RP score is calculated as: RP = PU(35) + QP(35) + IPR(15) + FPPP(15).
Here’s the key detail: NIRF uses objective data from three sources. Institutions submit data through the Data Capturing System (DCS). NIRF also pulls data directly from Scopus and Web of Science for publications. And they cross-reference funded projects with government funding agencies like SERB, DST, and CSIR.
This means you cannot fudge publication counts or citation numbers. But you absolutely can leave projects and consultancy undocumented, which makes FPPP completely invisible to NIRF.
Where universities drop points on the RP parameter
Gap 1: Publication documentation gaps
Universities assume that if faculty published something, NIRF will find it in Scopus. It won’t happen automatically. The paper must be:
- Published in a journal indexed in Scopus or Web of Science (preprints and conference proceedings don’t count unless indexed)
- Properly attributed to your institution (author affiliation must list your university name exactly as registered with NIRF)
- Listed in the DCS system with correct publication date and journal name
Private universities often have gaps here because they don’t systematically track which faculty publications are Scopus-indexed. They lack an institutional database. When NIRF requests data, they’re manually piecing it together from faculty CVs and departmental emails. They miss publications.
Top universities maintain spreadsheets updated quarterly by department heads, with each publication verified against Scopus directly.
Gap 2: Quality of publications underweighting
Publishing in Scopus is not enough. The QP metric rewards citations. A faculty member with 10 highly cited papers scores much higher than someone with 20 modestly cited papers.
The universities scoring highest in QP typically publish in journals with higher average citation counts (not necessarily high impact factor, but journals where papers accumulate citations), have research groups focused on practical problems (applied research gets cited more than theoretical work), and actively promote their papers through institutional repositories and conference presentations (visibility increases citations).
Many Indian universities publish in Scopus journals but choose journals with low average citation rates. They publish but don’t promote their own work, so citations stay low.
Gap 3: Complete invisibility on FPPP
This is where most universities lose the most points. The FPPP metric includes three things:
Funded research projects: Government grants (SERB, DST, CSIR, UGC-SAP), private foundation grants, and industry-sponsored research. NIRF cross-references government funding agency databases, so government projects are usually captured. Industry-sponsored projects are often undocumented because industry sponsors sometimes request anonymity (though NIRF still counts it if you document it in DCS), universities don’t systematically track industry funding institutionally, and there’s confusion about what counts (consultancy vs. research project).
Consultancy revenue: Services rendered to external clients for a fee. Consulting projects, market research, testing services, training programs sold to industry. This is revenue that directly shows industry-academia engagement.
Most universities don’t track consultancy at the NIRF level. They might track it for revenue purposes, but they don’t consolidate and report it in DCS. Private universities especially leave this blank.
Research data shows that between 2018 and 2023, top-25 institutions doubled their research projects and saw funding increase over 50%. But consultancy grew similarly, with top institutions executing fewer but higher-value projects, while others grew through volume.
Gap 4: Wasted IPR potential
Patents are part of IPR scoring, but they’re only 15 points out of 100. Yet universities often obsess over patents while ignoring funded projects (which are part of FPPP). A university with 50 patents but no documented consultancy leaves 15 points on the table. One with 5 patents but solid consultancy documentation scores the same on IPR but wins on FPPP.
The strategy: pursue valuable patents, but don’t let the patent search distract you from documenting projects and consultancy.
Six tactics to improve your RP score in 12-18 months
1. Audit your Scopus author profiles and ensure correct institutional affiliation
This is the first step. Log into Scopus (your library should have institutional access) and search for your faculty members directly.
For each faculty member with publications:
- Check if their author profile lists your institution correctly
- Verify the affiliation string (some list “University of X,” others list “X University” or abbreviations, and NIRF is sensitive to these differences)
- If the affiliation is missing or wrong, edit the author profile to correct it
- Ensure the faculty member has claimed ownership of their author profile
This single step typically recovers 3-7 publications per faculty member that were attributed to wrong institutions in NIRF’s data pull.
Timeline: Audit in Q1, corrections take 4-6 weeks to reflect in Scopus.
2. Create an institutional research tracking system (not just for NIRF, but for internal visibility)
Build a spreadsheet or lightweight database that tracks:
- Faculty name
- Department
- Publication title
- Journal name and impact factor
- Scopus ID
- Citation count (updated quarterly)
- Publication date
- URL
Use this to identify:
- Which journals your faculty publishes in most (are they high-citation-rate journals?)
- Which faculty members are most productive
- Which research areas are generating citations
- Gaps in documentation
This isn’t paperwork for NIRF. This is internal intelligence that helps you make strategic decisions about research promotion, journal selection, and faculty hiring.
Timeline: Build in Q1, maintain quarterly, use findings for Q2-Q4 planning.
3. Shift faculty journal selection toward higher-citation-average journals
Work with your faculty to publish in journals where papers accumulate more citations on average. This isn’t about impact factor alone. A journal with IF 3.5 where papers average 8 citations is better than IF 5.2 where papers average 2 citations.
Use Scimago Journal Rank or Journal Citation Reports to identify journals in your discipline where:
- Papers average 5+ citations
- The journal is indexed in Scopus/Web of Science
- Acceptance rates are reasonable (not vanity journals, not predatory journals)
Set a target: 60% of faculty publications should be in identified high-citation-average journals.
This naturally increases QP score without requiring more publications. You’re optimizing where your existing research gets published.
Timeline: Implement from Q2 onwards, see QP improvement in next NIRF cycle.
4. Systematically document all funded research projects in your DCS system
Create a process where every research project (government funded, industry sponsored, or private foundation funded) is documented in NIRF’s Data Capturing System with:
- Project title
- Funding agency name
- Total funding amount
- Project duration
- Faculty principal investigator
- Current status (active, completed)
This is not optional. If it’s not in DCS, NIRF doesn’t count it. Period.
For government projects: NIRF cross-references databases, so these usually appear even if you don’t document them. But don’t rely on this. Submit them anyway.
For industry and private projects: You must submit these. Use a standard format for funding agency names (don’t write “ABC Corp” one time and “ABC Corporation” another; standardize).
Timeline: Audit existing projects in Q1. Establish a process where every new project is documented within 30 days of approval. Target: submit complete FPPP data by July (before NIRF data window closes).
5. Create a consultancy revenue tracking system and target minimum consultancy figures
Consultancy is underutilized. Private universities especially don’t track this. Yet consultancy counts as professional practice, signals industry relevance, and directly affects FPPP scoring.
Create a policy where departments or faculty can offer:
- Testing and certification services
- Market research and feasibility studies
- Training and capacity-building programs
- Technical consulting in your discipline
Track consultancy revenue by:
- Service type
- Client organization
- Revenue amount
- Faculty involved
Set a target. If you’re a mid-tier university with 200+ faculty, aim for consultancy revenue of Rs 50-100 lakhs annually. This translates into clear FPPP improvement.
Timeline: Build the system in Q1-Q2. Execute and track from Q3-Q4. Report in NIRF data submission.
6. Develop a research promotion strategy focused on conference visibility and citations
High-citation papers typically have one thing in common: the authors actively presented the research at conferences and meetings. This isn’t about self-promotion. It’s about making research discoverable to people who might cite it.
Create a policy where:
- Faculty are encouraged and funded to present papers at top-tier national and international conferences
- Your institution maintains a database of faculty conference presentations
- Presentation slides include your institution’s branding and logo
This increases visibility, leads to collaborations, and ultimately drives citations.
Timeline: Implement from Q2 onwards. See citation impact in publications 12-18 months old (which is what NIRF measures in the next cycle).
Measuring your RP improvement
Before making changes, establish a baseline. Request the official NIRF RP methodology document from nirfindia.org. Pull your previous year’s detailed score breakdown from the NIRF portal.
Track these metrics quarterly:
- Total publications in Scopus/Web of Science (target: 5-8% growth annually)
- Average citations per paper (target: 2-3% improvement in citations per paper annually)
- h-index of your institution (target: steady increase)
- Documented funded projects (target: 100% of projects documented in DCS)
- Consultancy revenue (target: annual growth of 15-20%)
- Patents published/granted (target: maintain or grow modestly)
The RP score improvement isn’t linear. You might see a 2-3 point jump in one cycle if you fix documentation gaps. The next cycle might see 1-2 points from growing publications. In 18-24 months, comprehensive RP improvement typically yields 8-15 additional points.
Key takeaways
- RP is 30% of NIRF. It’s the largest parameter and worth focused effort.
- RP measures four distinct things: publications (35), quality of publications (35), patents (15), and projects/consultancy (15).
- Most universities lose 8-15 points because they don’t document projects or consultancy properly.
- Publication quality matters as much as quantity. A high-citation paper is worth more than five low-citation papers.
- Scopus affiliation errors are common. Fixing institutional affiliation strings recovers lost publications.
- Consultancy is invisible to most universities but counted by NIRF. Build a tracking system.
- Timeline is important. You can’t build an RP score in one cycle. Start now for next year’s ranking.
Next steps
To truly improve your NIRF ranking, RP improvement must be part of a larger strategic plan that includes all parameters. Start with how to improve your NIRF ranking across all five parameters for a full framework.
The universities that move 15+ points on NIRF rankings year-over-year systematize what we’ve outlined here. They don’t assume knowledge will be found. They document it. They don’t hope publications get cited. They strategically position research for visibility. They don’t lose points on consultancy. They track it.
If you’re implementing an RP improvement plan, schedule a conversation with our team. We’ve built NIRF data strategies for universities that recovered 5-8 points through documentation fixes alone.