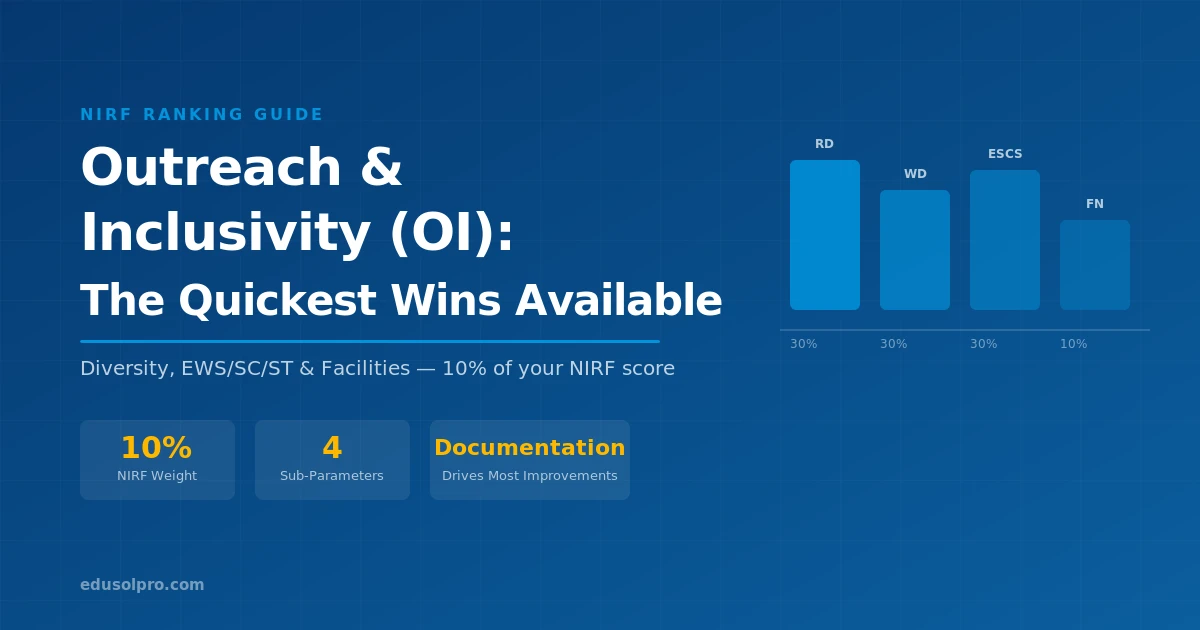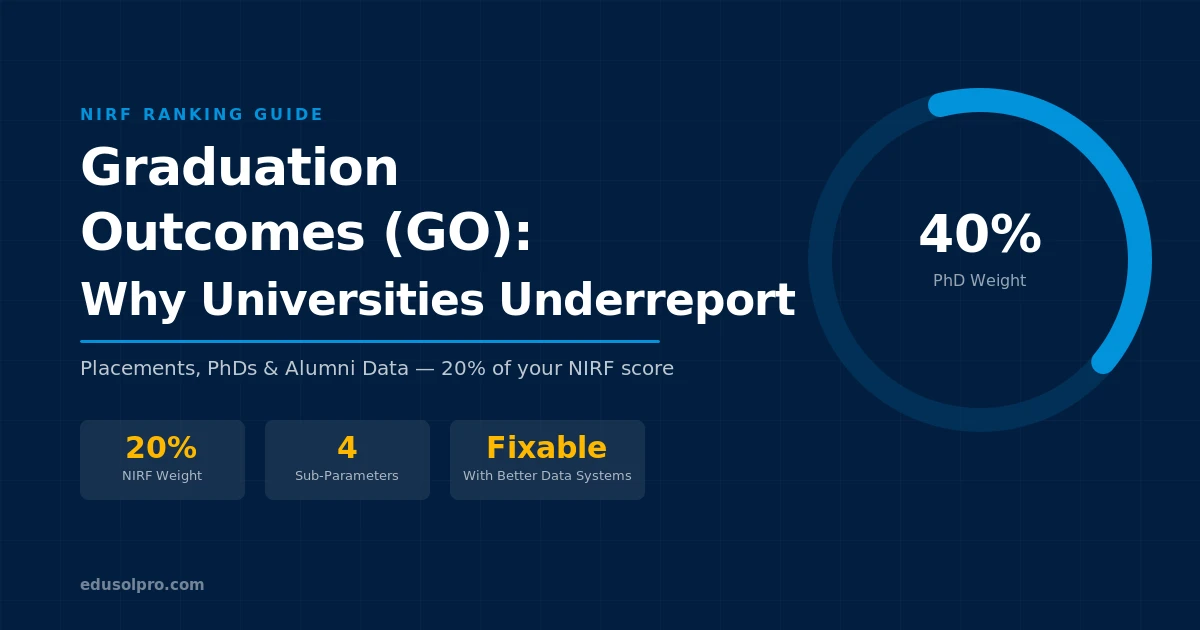
The Graduation Outcomes (GO) parameter carries 20% of your NIRF score. It’s most directly tied to what students care about: jobs, salaries, further studies, and PhDs awarded. The gap between an institution’s real performance and its NIRF score is usually caused by data collection failure, not weak outcomes.
Universities with strong placement records regularly score less than they should on GO because they lack alumni tracking systems that meet NIRF’s documentation requirements. This article explains how GO is calculated, where common failures occur, and what you can realistically fix in the short term versus what needs a 2–3 year horizon.
For official NIRF GO methodology and updates, see www.nirfindia.org.
What GO measures
Graduation Outcomes has four sub-parameters:
PhD-related metrics and median salary together account for 65% of the GO score. These are the two sub-parameters worth the most attention.
The alumni tracking gap
Here’s the core problem: NIRF requires documentary evidence for each placement claim. An offer letter is not sufficient on its own. NIRF wants proof of actual joining — which typically means appointment letters, salary slips, or employer confirmation letters, depending on the category.
Most universities maintain a placement figure based on offers received, not offers accepted. The difference between “offered a job” and “joined a job” is real, and NIRF only counts the latter.
The fix is structural. You need an alumni data system that captures joining confirmation at the time of joining, not six months later.
What a minimum viable alumni tracking system looks like:
- At graduation, collect: personal email, phone, LinkedIn URL, emergency contact
- At 3-month post-graduation mark: automated follow-up asking for employment/higher studies update with a simple form
- Employer confirmation: a standard letter template your placement cell sends to HR departments for bulk confirmation
- For higher studies: university admission letters are clean evidence — students are generally willing to share these
This system doesn’t require expensive software. A Google Form, a spreadsheet, and a consistent follow-up process do the job. The investment is in making the process someone’s specific responsibility.
Median salary: not the number you think
The Median Salary (MS) sub-parameter catches universities off-guard because they assume NIRF uses the same salary figure they quote in marketing materials.
NIRF’s median is the midpoint of actual joining salaries for students who took employment. It’s not the average. It’s not the highest package. It’s not the figure from your placement brochure.
If your top 10% of placed students earn significantly more than the rest, your median is much lower than your mean. Your MS score reflects the median, not the mean.
What drives median salary improvement:
- Placement with core-sector employers (manufacturing, banking, government PSUs) tends to produce more consistent salary bands than pure IT placement, which has high variation
- Improving the bottom half of placements matters more for the median than adding more high-paying offers
- Higher studies students don’t dilute the MS calculation — they’re counted separately in the RP sub-parameter
PhD awards: a 3-year problem
The PhD sub-parameter has a 40% weight within GO. It measures both PhDs awarded in the reporting period and the current PhD enrolment strength.
The challenge with improving this sub-parameter quickly: PhD programmes typically take 3–5 years. If you didn’t enrol PhD students at scale 3–5 years ago, you won’t have many PhDs to award this year. There’s no shortcut.
What you can do now that will improve scores in 2–3 cycles:
- Maximise current PhD enrolment. Every PhD student enrolled this year is a potential PhD award in 3–4 years.
- Identify faculty who have registered PhD scholars informally — scholars working in labs who haven’t been formally registered in the DCS. Formalise and register them.
- Check if your institution has any JRF or SRF holders funded through external grants who are working towards PhDs. These count, and they’re often missed.
- Set a target for PhD enrolment as a proportion of UG strength — even a modest target (say, 3–5% of UG enrolment) applied consistently creates a meaningful PhD pipeline.
GUE: the easy marks
University Examinations (GUE) measures pass rates and the ratio of students appearing in exams to enrolled students. It’s often the quickest to improve because it’s almost entirely a data accuracy issue.
Common errors:
- Counting students who were de-enrolled or discontinued as “eligible but not appeared” rather than removing them from the count
- Not counting supplementary examination pass outs in the same cycle
- Missing transfer-in students who appeared in exams but whose enrolment category is unclear
For most institutions, auditing the raw exam data against the DCS submission finds legitimate improvements of 3–5 percentage points without any change in actual academic performance.
What to fix this year vs. what takes 2–3 years
| Action | Timeline | GO Impact |
|---|---|---|
| Audit GUE data — fix exam appearance vs. enrolment discrepancies | 1–2 months | Quick |
| Implement alumni follow-up process for current batch | 3–6 months | Medium |
| Formalise PhD registrations for informally working scholars | 3–6 months | Medium |
| Build median salary tracking with verified joining confirmation | 6–12 months | Significant |
| Increase PhD enrolment targets — new scholars enrolled now | 1 year | 3-year payoff |
| PhD completions from current enrolment cohorts | 3–5 years | Long-term |
FAQs
Does NIRF count students who accepted offers but didn’t join? No. NIRF requires evidence of actual employment, not just offer letters. The joining confirmation is what matters — offer letters alone are insufficient documentation.
How does NIRF verify median salary? NIRF relies on the data submitted in the DCS along with supporting documentation provided during the verification process. Salary slips, appointment letters showing CTC, and employer confirmation letters are the most commonly accepted proof formats.
Do students who pursue higher studies help or hurt our GO score? They help. Higher studies are counted separately in the RP (Placement & Higher Studies) sub-parameter. A student who joins an IIM or a foreign university for a Master’s is counted positively — you need clean evidence (admission letter or enrollment certificate) to claim this.
What if our PhD supervisors guide scholars from other universities? PhD awards count for the institution where the scholar was enrolled, not the supervising faculty member’s institution. If you have faculty supervising external scholars, those awards don’t contribute to your GO score.
Can we improve our GO score without changing actual placement performance? Yes, significantly. Better documentation, alumni tracking, and accurate GUE data often unlock marks that institutional performance has already earned but the DCS submission failed to capture.
Graduation Outcomes is the NIRF parameter with the highest ratio of “marks left on the table due to process gaps” versus “marks left on the table due to genuine institutional weakness.” Build the data systems first. The performance improvements will take years to show up; the documentation improvements can show up in the next cycle.
For the full picture across all parameters: