In 2015, the Ministry of Education launched NIRF with one goal: bring accountability and measurable quality standards to India’s sprawling higher education system. Ten years and ten editions later, we have the most comprehensive longitudinal dataset ever assembled on Indian universities.
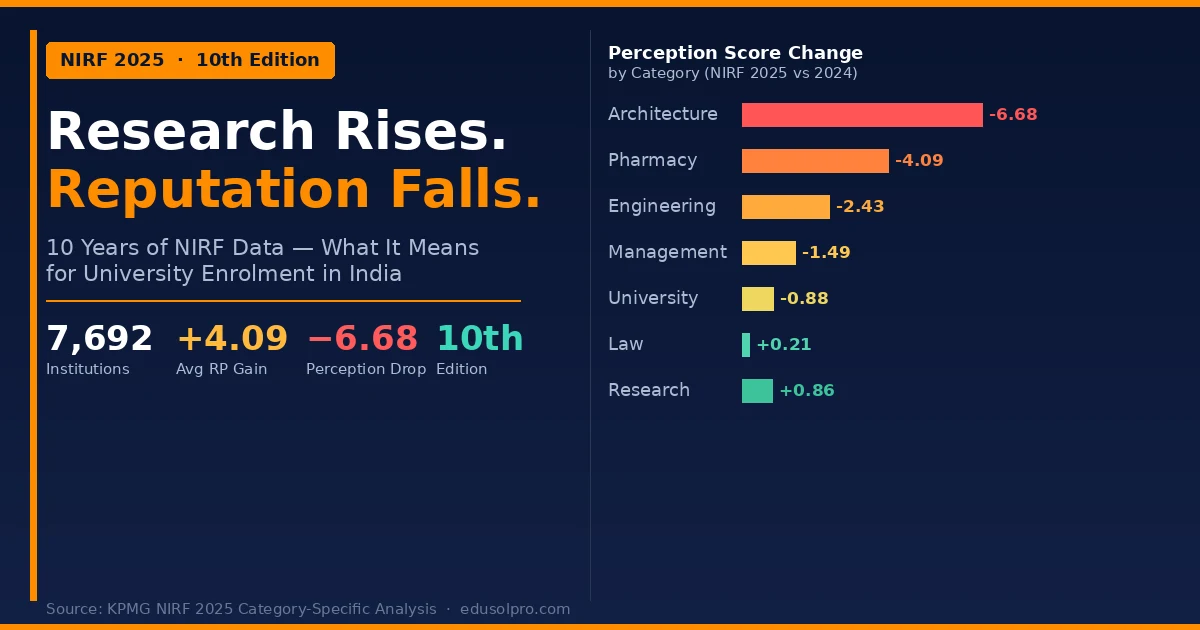
The tenth edition of NIRF — released on 4 September 2025 — covered 7,692 institutions across 17 categories. KPMG’s October 2025 category-specific analysis of this data reveals a story that is simultaneously encouraging and urgent.
The encouraging part: research output is surging, faculty quality is improving, and graduation outcomes are strengthening across almost every category. The urgent part: perception scores are falling — sharply — in engineering, pharmacy, research institutions, and architecture. India’s universities are getting better. They are not getting credit for it.
This analysis breaks down exactly what the NIRF 2025 data shows, what it means by category, and what university marketing and leadership teams should actually do about it.
The Scale: 7,692 Institutions and 10 Years of Growth
Participation in NIRF has grown from 2,426 institutions in 2016 to 7,692 in 2025 — a 217% increase over the decade. The college category alone grew from 535 institutions to 4,030, a 402% expansion. Law grew 276%, from 71 to 267 institutions. Medical participation more than doubled.
Total submissions reached 14,163 in 2025 — a 31% increase from 2024 alone. Skills universities grew 175% in participation; open universities by 25%, reflecting growing national emphasis on flexible and vocational pathways.
This growth matters for one reason above all others: competition. Every additional institution in the NIRF ecosystem is another university competing for student attention, media coverage, and peer recognition. As the pool grows, visibility at the top becomes harder to maintain, and the cost of a weak marketing and reputation strategy rises every year.
The Research Revolution: India’s Biggest Higher Education Win
If there is one area where India’s higher education system has genuinely transformed over the past decade, it is research. NIRF 2025 data documents this unambiguously.
Publications have surged. Universities and engineering institutions recorded approximately 150% growth in publication output between 2018 and 2025. Pharmacy and management institutions saw an extraordinary average 300% growth in publications over the same period. India’s share of global research publications rose from 3.5% in 2017 to 5.2% in 2024. In certain disciplines, the shift is even more pronounced: management institutions have scaled research contributions to roughly 5% of global share, up from 2% in 2018.
PhD pipelines are expanding. PhD enrolments in the university category grew 21% between 2019 and 2025 — from 97,947 to 118,556 students. Equally significant: PhD completions grew by nearly 49% over the same period, from 16,403 to 24,481 graduates annually. This is not just enrolment growth — it is throughput improvement.
Faculty quality is rising. The proportion of PhD-qualified faculty in engineering institutions grew from 28% in 2017 to 48% in 2025. Top-ranked management institutions now report over 90% PhD faculty; top engineering colleges exceed 80%. Across the top 100 institutions overall, the share is approaching 60%.
Patents are accelerating. India’s total patent filings have doubled since 2015. Educational institutions have tripled their patent filings between 2022 and 2024 alone, positioning India among the top six countries globally for patent activity.
Industry funding is increasing. Average sponsored research funding increased across all rank bands. The gap between top institutions and others is significant — institutions ranked 1-25 receive approximately nine times the sponsored research funding of those ranked 76-100 — but even the lower bands show meaningful growth in both project count and funding value.
What this means for how universities should position themselves is discussed in detail in our guide to improving your NIRF Research Score. The short version: if your institution has improved its research output but you haven’t made that publicly visible — in admissions communications, on your website, in media outreach — prospective students, peer academics, and employers do not know about it. That gap is exactly what the perception data below reflects.
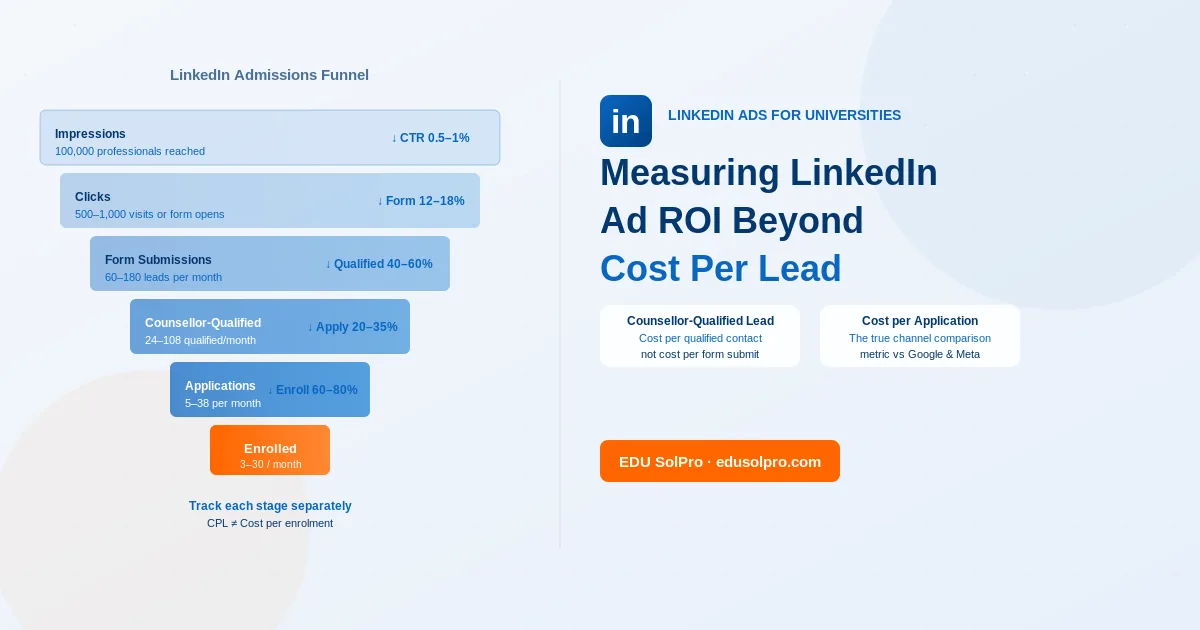
The Perception Crisis: Getting Better Without Getting Credit
This is the central finding of NIRF 2025 — and the one that has the most direct implications for university enrolment.
Perception scores declined across most categories in 2025 versus 2024. The declines are not marginal. In architecture and planning, the perception score fell 6.68 points — the worst in any category. In pharmacy, it fell 4.09 points. Research institutions dropped 3.35 points. Engineering dropped 2.85 points. Management fell 1.49 points. Medical and dental also declined.
Only agriculture (+3.12), universities (+1.09), law (+0.32), and colleges (+0.23) recorded positive perception movement.
The paradox is stark. Research is up. Faculty quality is up. Graduate outcomes are up. Perception is down.
Understanding why requires knowing how the NIRF perception parameter actually works. It is not based on outcomes data. It is based on academic peer surveys — where faculty and researchers at other institutions rate your institution — and employer perception surveys. Both of these depend not on what you have achieved but on whether the people being surveyed have heard about it, read about it, or encountered evidence of it.
An institution that improves its PhD output, boosts its research funding, and places more graduates into good roles — but does not actively communicate those achievements to the academic and employer community — will still score poorly on perception. The data improves; the reputation does not follow automatically.
This is a marketing and communication failure. It is also a solvable one.
We cover the specific mechanics of improving your NIRF Perception Score in depth here. The key levers are alumni engagement for peer survey awareness, media placement that builds institutional name recognition, employer relationship programmes, and systematic management of your institution’s online presence — what people find when they search your name on Google, Shiksha, and CollegeDunia.
Category-by-Category Scorecard
Universities
Average score rose from 53.89 in 2024 to 55.13 in 2025. Perception actually improved slightly (+1.09), making universities one of the few categories to resist the broader perception decline. Public institutions still dominate — 56 of the top 100 are government or publicly funded. Tamil Nadu leads with 20 institutions in the top 100.
The most competitive band is ranks 61-100. In this band, 40 institutions are clustered between scores of 47.07 and 51.06. A gain of just 3.99 points can translate to a 40-position rank jump. This is the zone where strategic data management and reputation investment has the highest ROI — small improvements create large visibility gains.
Engineering
Average score improved from 55.88 to 56.81. PhD faculty grew to 48% of total faculty. Research and GO parameters both improved. But perception fell 2.85 points — the third-steepest decline after architecture and pharmacy. Engineering institutions are delivering better outcomes but losing the perception battle.
Management
Average score rose from 54.45 to 56.19. TLR improved 1.78 points and GO improved 0.94 points. Research improved 3.25 points. Yet perception fell 1.49 points. The institutions with the strongest TLR improvement did not convert those gains into better reputation scores. More than 90% of top-ranked management institutions have PhD-qualified faculty — but that statistic is not reaching the employers and academics who fill the perception surveys.
Medical
Average score rose marginally from 60.62 to 61.11. Medical institutions tend to have consistently high scores across parameters. Perception fell by 0.97 — modest relative to other categories.
Dental
Average score rose significantly from 58.19 to 60.66. GO surged 8.68 points — the strongest graduation outcome improvement of any category in 2025. RP fell 3.05 points. Perception fell 1.84.
Pharmacy
Average score rose from 52.68 to 54.24. GO improved 4.71 points. But perception fell 4.09 points — the second-worst decline after architecture. For pharmacy institutions specifically, the gap between improving outcomes and declining peer/employer perception is a structural issue that requires active intervention.
Law
Average score rose from 59.22 to 62.31 — one of the strongest improvements in absolute terms. Law is one of the few categories where perception also improved (+0.32). It has the highest average score of any category at 62.31.
Colleges
Average score rose from 58.51 to 62.05. TLR improved 3.54 points, RP improved 7.15. Perception improved 0.23. The college category, despite its massive scale (4,030 institutions), showed the most balanced improvement across all five parameters.
Architecture and Planning
The only category where average scores declined overall — from 59.09 in 2024 to 58.76 in 2025. TLR fell 0.97 points. Perception fell 6.68 points — the steepest decline of any parameter across any category in 2025. Architecture institutions are investing least in both quality improvement and brand communication simultaneously. Recovery requires action on both fronts.
Agriculture and Allied Sectors
Average score rose from 54.76 to 57.16. Agriculture is the only category where perception meaningfully improved (+3.12) alongside strong gains in GO (+4.66) and OI (+2.96). This suggests that agricultural universities — often state-funded and regionally grounded — are better at maintaining relationships with the academic and industry peers who fill perception surveys.
Private Universities Are Catching Up
A significant finding embedded in the NIRF 2025 data: among institutions that have shown the most dramatic rank improvements over the past four years, over 80% are private universities.
These are not marginal gains. They represent a structural shift in how private institutions are approaching quality and ranking improvement — with greater investment in faculty development, research infrastructure, and crucially, data management for NIRF submission.
The implication for public institutions is direct: the competitive landscape is shifting. The assumption that government-funded institutions have permanent perception advantages is weakening. Private institutions that combine quality improvement with active reputation management are eroding that gap faster than most public university leaders realise.
Graduate Outcomes and the Salary Story
The GO parameter improved across all categories except medical (where it was marginally negative at -0.07). Agriculture saw the strongest GO improvement (+4.66), followed by dental (+8.68) and law (+3.24).
On salaries, the KPMG report notes that median graduating student salaries have nearly doubled over the past five years across both top-quartile and lower-quartile institutions. This is significant. It means placement quality is improving not just at IITs and IIMs but at institutions ranked 51-100 and beyond.
What is not happening is the systematic publication of this data in admissions materials. Universities are collecting placement data for NIRF submissions but not converting it into marketing assets — program pages, admissions brochures, social media, and employer-facing content. Every verified salary benchmark is an admissions argument waiting to be deployed. Most institutions leave it in a spreadsheet.
What This Data Means for University Enrolment Marketing
Nine direct implications for university marketing and leadership teams:
1. Your research story is your most underused asset. Publication growth of 150-300% over seven years is extraordinary. If prospective students, parents, and peer academics cannot find evidence of that growth on your website, in your PR, or in your social content, it does not exist in their perception of you.
2. Perception improvement requires active outreach, not outcome improvement. The data proves this. Categories with the best outcome gains (pharmacy GO +4.71, dental GO +8.68) still showed the worst perception declines. Outcomes and perception are separate problems with separate solutions.
3. The ranks 61-100 band is the highest-ROI zone for strategic investment. A 3.99-point improvement can yield a 40-position rank jump. Targeted work on a single underperforming parameter — especially perception — can have disproportionate visibility impact.
4. Private institutions are raising the bar. If your institution is public or government-funded and you are treating your NIRF strategy as a compliance activity rather than a competitive one, you are losing ground to private institutions that treat it as a brand-building exercise.
5. GO data is your single strongest admissions proof point — if you publish it. Nearly doubled salaries over five years is a more compelling argument than any brochure headline. Verify it, publish it, amplify it.
6. The perception survey window is a marketing window. NIRF perception scores are derived from academic peer and employer surveys conducted at specific points in the year. Institutions that actively engage their alumni, peer networks, and industry partners during those windows outperform those that do not. This is a planned communications activity, not a passive outcome.
7. Architecture institutions need both quality and brand work simultaneously. The combination of falling TLR and falling perception is the worst possible scenario — it signals decline in inputs and in reputation together. Recovery requires investment on both fronts before the next NIRF cycle.
8. Agricultural universities have something to teach everyone else about perception management. The +3.12 perception gain in agriculture while other categories declined is an anomaly worth studying. Regionally embedded institutions with strong industry and government relationships perform better on peer and employer surveys because those relationships are already active. The lesson is applicable to every institution type.
9. A weak online reputation directly undermines your NIRF score. Students, employers, and even peer academics search for your institution online before forming opinions. What they find on Google, Shiksha, and CollegeDunia shapes the survey responses that determine your perception score. Our ORM and Reputation Management service addresses exactly this link between digital presence and institutional perception.
A 12-Month NIRF Perception Improvement Roadmap
For institutions where perception score is the biggest drag on overall NIRF rank, here is a practical roadmap structured around the annual NIRF cycle.
For a deeper framework on each NIRF parameter, read our complete guide to improving NIRF rankings.
The Decade’s Real Lesson
Ten years of NIRF data reveal a system that has done something genuinely difficult: it has created a culture of measurement and accountability in an education ecosystem that previously had neither. The evidence is in the numbers. Research output up 150-300%. PhD pipelines expanding. Graduate salaries nearly doubled. India among the top six countries globally for patent activity.
The problem is the gap between what institutions are achieving and what they are communicating. Perception scores are falling not because institutions are getting worse — they are manifestly getting better — but because the communication infrastructure has not kept pace with the quality infrastructure.
The institutions that will win the next decade of NIRF are not necessarily those with the largest research budgets or the most PhD faculty. They will be the institutions that understand reputation as a strategic asset, manage it systematically, and connect their genuine quality improvements to the peers, employers, and students who need to know about them.
That is not a rankings problem. It is a marketing problem. And it is solvable.
Data in this analysis is sourced from the KPMG NIRF 2025 Category-Specific Analysis Report (October 2025) and the official NIRF India Rankings 2025 Report published by the Department of Higher Education, Ministry of Education, Government of India.