NIRF season is stressful. Every January and February, institutional data teams scramble to plug numbers into the Data Capturing System, hoping the final rank reflects years of genuine work. And every year, the same question surfaces: why did our rank drop when we’ve clearly improved?
The answer is almost never that the institution didn’t do enough. Usually it’s one of two things: either the data doesn’t reflect the quality, or the institutions you’re competing against got better at documenting their quality.
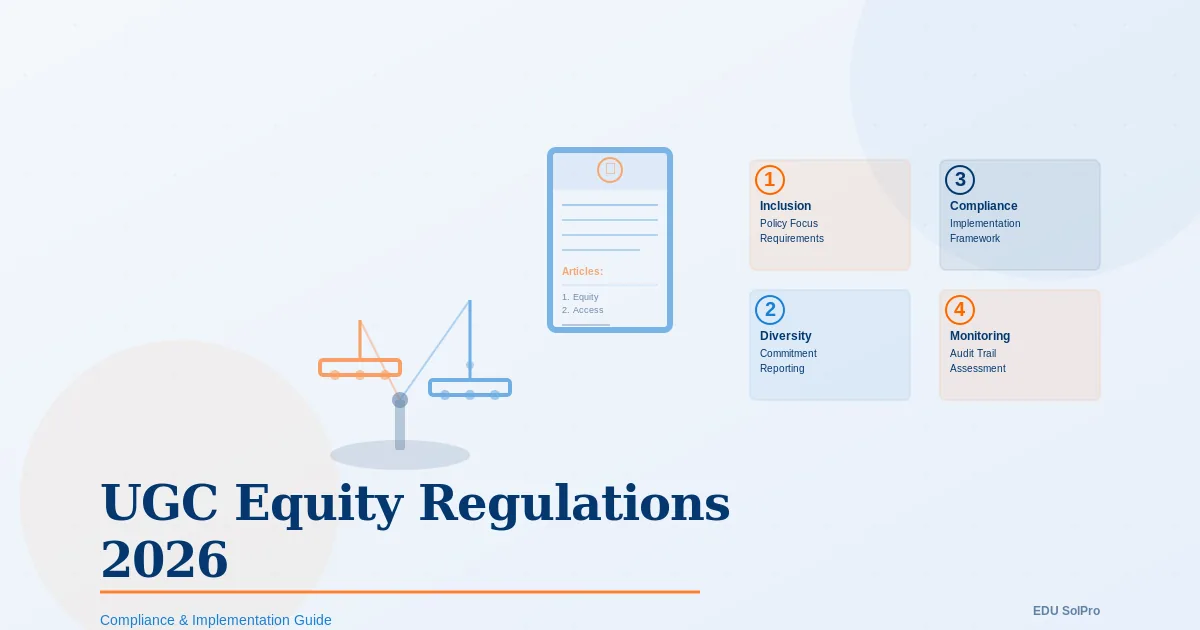
This guide breaks down each NIRF parameter in plain language, where institutions most commonly lose marks without realising it, and what a realistic year-round improvement plan looks like. It’s for Vice Chancellors, Registrars, and IQAC teams who need a working framework, not a government manual.
Jump to a section:
- Why NIRF rankings matter now
- TLR — Teaching, Learning & Resources (30%)
- RP — Research Score (30%)
- GO — Graduation Outcomes (20%)
- OI — Outreach & Inclusivity (10%)
- PR — Perception (10%)
- Common mistakes that quietly kill your rank
- 12-month readiness roadmap
Why NIRF Isn’t Just About Prestige Anymore {#why-nirf}
For the 2026 cycle, over 14,000 Higher Education Institutions participated, roughly 24% of all HEIs in India according to AISHE data. Institutions that don’t participate are already losing the perception battle.
The stakes are concrete. Top-tier NIRF rankings influence RUSA grant eligibility, attract international collaboration, and shape how students and parents choose where to apply. A growing segment of applicants now treats the NIRF list as their primary filter, often ahead of NAAC grades or marketing materials.
A higher rank doesn’t just signal quality. It drives enrolment.
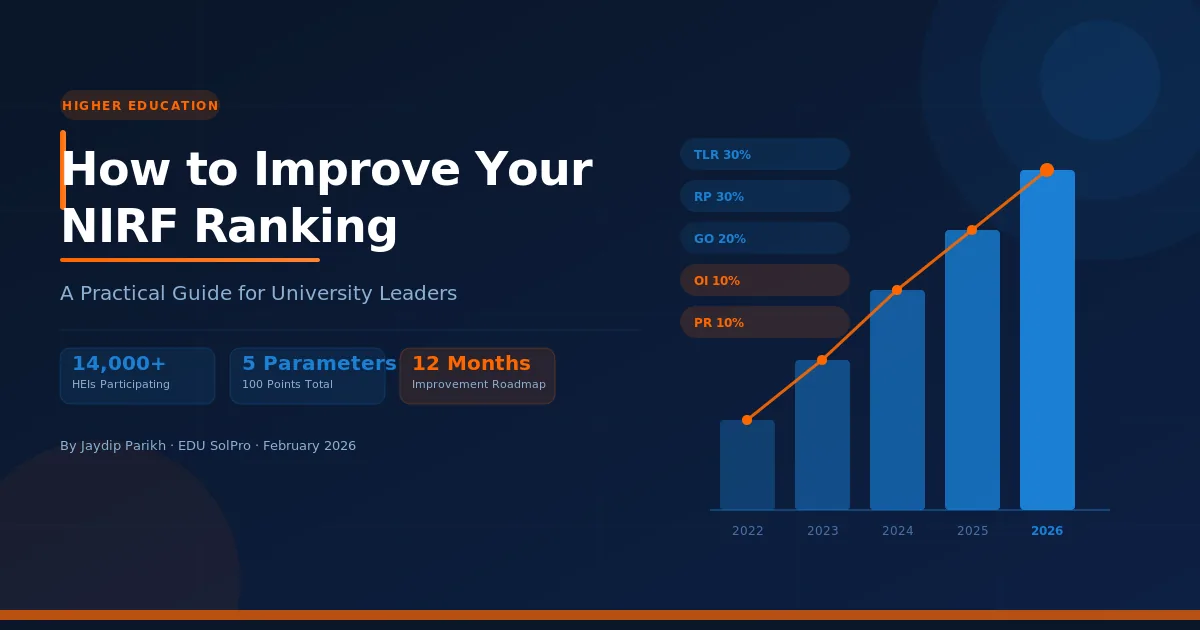
The 5 Parameters That Determine Your NIRF Rank — And How to Improve Each
NIRF evaluates every institution on five parameters. If even one is consistently weak, it pulls down the rest.
| Parameter | Weight | What It Measures |
|---|---|---|
| TLR — Teaching, Learning & Resources | 30% | Faculty quality, infrastructure, financial utilisation |
| RP — Research & Professional Practice | 30% | Publications, citations, patents, funded projects |
| GO — Graduation Outcomes | 20% | Placements, higher studies, competitive exam results |
| OI — Outreach & Inclusivity | 10% | Diversity, economic inclusion, disability access |
| PR — Perception | 10% | Academic peer and employer reputation |
These weightages apply to the Overall category. Law, Architecture, and Colleges categories use different distributions — the Law and Colleges categories, for instance, weight Research at only 15%.
How to Improve Your TLR Score: Faculty, Infrastructure & Financial Utilisation [30%] {#tlr}
This is the institutional backbone. Faculty count, infrastructure quality, and financial utilisation all feed into TLR. The single biggest sub-parameter is Faculty-Student Ratio (FSR) — worth 30 marks out of 100 within this parameter alone.
The most common error is over-counting. Only full-time, regularly appointed faculty count fully, and only if they hold at least a Master’s degree. Ad-hoc or contract faculty count only after two consecutive semesters in the academic year. Visiting faculty carry a 0.3 weightage: five visiting professors equal 1.5 regular faculty in the FSR calculation. A professor who ran a two-day workshop doesn’t count at all.
The other key metrics are Financial Resources and Utilisation (FRU), which measures how well you spend your budget, not just how large it is, and the combined metric for faculty with PhDs and experience (FQE). A well-resourced institution with stable, qualified faculty consistently outscores one that relies on temporary hires. NAAC assessments evaluate institutional health from a different angle.
For a detailed breakdown of every TLR sub-parameter and a 12-month improvement roadmap, read our complete guide to the NIRF TLR score.
How to Improve Your Research Score (RP): Publications, Citations & Patents [30%] {#rp}
If TLR measures teaching strength, RP is where rankings are won or lost. Two sub-parameters dominate: PU (Publications, 35 marks) measuring volume of research output normalised by faculty count, and QP (Quality of Publications, 35 marks), split into Citation Count (20 marks) and a Top 25th Percentile metric for papers in globally top-quartile journals (15 marks).
Most institutions miss this point: NIRF doesn’t rely on self-reported research data. It pulls from Scopus and Web of Science. If a faculty member’s published work isn’t indexed on those platforms, it doesn’t count. This is why institutions with strong research output can still score poorly on RP. Their work exists in journals Scopus doesn’t index.
The remaining RP sub-parameters cover IPR and Patents (15 marks, where granted patents score roughly twice what filed patents do) and Footprint of Projects (15 marks for sponsored research income and consultancy).
For the full RP breakdown — including how citation counts are calculated and what funded project documentation NIRF accepts — read the NIRF Research Score guide.
How to Improve Your Graduation Outcomes Score (GO): Placements, Alumni Tracking & Data [20%] {#go}
GO answers one question: what happens to your students after they graduate? Placements, higher studies, competitive exam qualifications (GATE, CAT, UPSC), and verified median salary all feed into this parameter.
For a detailed breakdown of each GO sub-parameter — including the median salary formula NIRF uses and how to build an alumni tracking system — read the NIRF Graduation Outcomes Score guide.
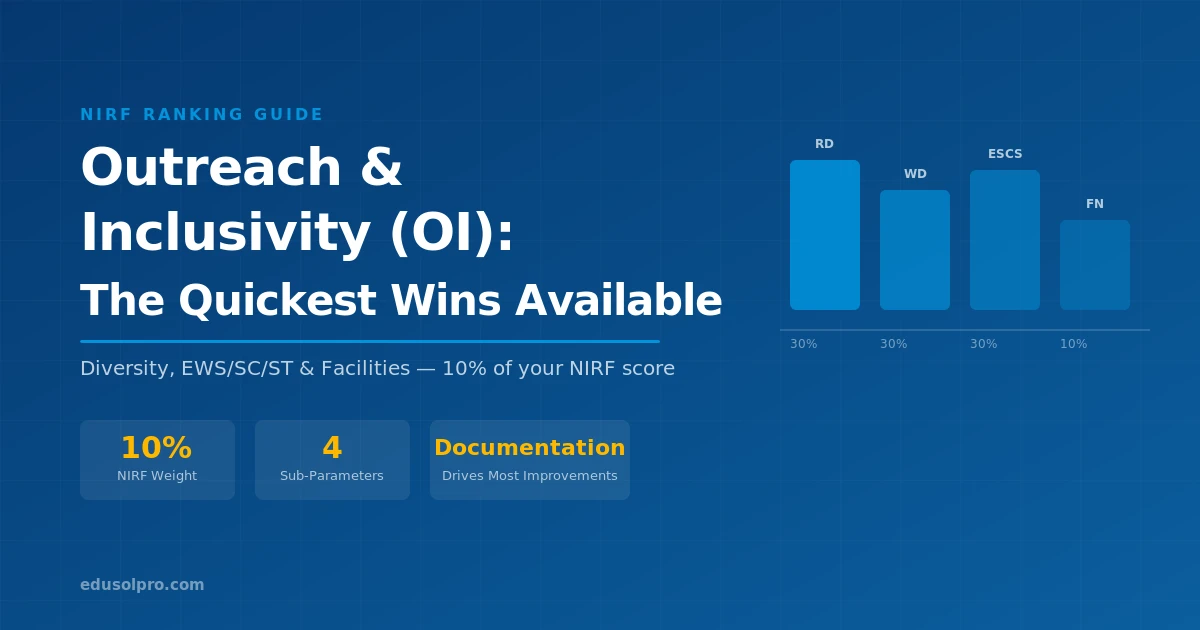
How to Improve Your OI Score: The Quickest Wins in NIRF [10%] {#oi}
Many institutions treat OI as a low-priority parameter because of its 10% weightage. That’s a miscalculation. It’s the single easiest parameter to improve with minimal investment.
Three areas contribute: gender and regional diversity among students and faculty; enrolment of economically and socially challenged students (ESCS); and physical accessibility facilities (PCS), worth up to 20 marks within OI alone.
For the full OI breakdown — including exactly what NIRF requires for EWS/SC/ST documentation — read the NIRF Outreach & Inclusivity guide.
How to Improve Your NIRF Perception Score: Where Reputation Management Matters [10%] {#pr}
PR is the most subjective parameter. It’s based on surveys sent to academic peers and employers, with no published formula or breakdown of who votes or how. Scores can swing rankings more than most institutions expect.
Three things consistently drive stronger Perception scores: research visibility (institutions with high citation counts naturally command more academic credibility), alumni in senior corporate, government, or academic positions, and consistent presence in credible media and industry forums.
The common view is that Perception is a lagging indicator you can’t influence. That’s only half right. You can’t force peers to vote highly. But you can absolutely control what they find when they search for your institution.
Think about it from the surveyor’s perspective. A peer receives the NIRF survey and sees your institution’s name. They search for it. If the first result is a well-maintained Wikipedia page with accurate, sourced information about your institution’s research milestones, faculty, and achievements — that shapes their impression. If your Vice Chancellor and leading researchers have visible thought leadership online, that’s another credibility signal. If what Google surfaces is thin, inconsistent, or dominated by old news, the impression is shaped by that gap instead.
This is where online reputation management for universities connects directly to NIRF. Not through gaming the survey — but by ensuring that what peers and employers find when they look you up accurately reflects the institution you actually are.
Common Mistakes That Quietly Kill Your NIRF Rank — And How to Fix Them {#mistakes}
These are the operational mistakes that quietly cost marks — not because institutions lack quality, but because the data doesn’t capture it.
The Name Disambiguation Problem
This is arguably the biggest silent killer in Research, and it’s a digital hygiene problem more than an academic one.
When a faculty member publishes as “Dr. S. Kumar” in one journal, “Suresh Kumar” in another, and “S. Kumar, IITD” in a third — while the institution is registered as “Indian Institute of Technology Delhi” on Scopus — those publications may not be attributed to your institution at all. NIRF’s automated systems scan Scopus and Web of Science. If the author name or institutional affiliation string doesn’t match the registered profile exactly, the publication simply doesn’t count.
The paper exists. The citations exist. The ranking system just can’t connect them to you.
This is the academic equivalent of technical SEO for universities. Consistent naming and metadata is the difference between being found and being invisible. Run a departmental audit and you’ll typically find faculty with orphaned publications that belong to your institution but aren’t credited to it.
The Sanctioned vs. Enrolled Trap
If your regulatory body has sanctioned 100 seats for a programme but you’ve enrolled 40 students, NIRF penalises you for those 60 empty seats. Low utilisation is treated as a demand signal. This is harsh for programmes that have declined in popularity but whose sanctioned intake hasn’t been formally revised with AICTE or UGC.
The Visiting Faculty Inflation Error
Five visiting faculty count as 1.5 regular faculty in the FSR calculation. If NIRF’s verification process detects inconsistencies between your submission and your NAAC or AISHE data — different faculty numbers, different student counts — it flags the entire submission. Over-counting visiting faculty is one of the fastest ways to trigger that flag.
The Duplicate Submission Problem
In the 2025 cycle, at least one institution’s constituent college was ranked separately because both the college and the central university submitted independently. NIRF treated them as different entities, splitting the data. If your institution has affiliated or constituent colleges, verify who is submitting, in which category, and with which affiliation, before the DCS window opens.
Alumni Tracking Gaps
Many institutions lose GO marks not because their graduates aren’t succeeding, but because there’s no systematic way to track outcomes after convocation. A student who cleared GATE, joined a company without going through the placement cell, or enrolled at another institution for postgraduate study simply doesn’t appear in the records. A structured alumni tracking process, even a simple CRM-based workflow, captures outcomes that currently slip through.
Your 12-Month NIRF Readiness Roadmap {#roadmap}
Improving your NIRF rank is a year-round process, not a January scramble. Here’s a quarterly plan your IQAC cell or NIRF team can act on right now.
- Conduct a full data audit — compare internal records against your last NIRF submission line by line
- Run a Scopus and ORCID audit across all departments; identify faculty with orphaned publications or mismatched affiliation strings
- Reconcile sanctioned intake figures with AICTE/UGC records; initiate formal revision requests where utilisation is consistently low
- Set up a dedicated NIRF cell if you don't have one; assign parameter owners for each of the Big 5
- Work with faculty to address Scopus indexing gaps — prioritise journals listed on Web of Science or Scopus
- Initiate or accelerate patent applications for qualifying research; track granted vs. filed status carefully
- Set up or audit your institutional research repository for discoverability and proper metadata
- Begin building a structured alumni tracking process — connect placement and academic affairs teams around a single shared database
- Review and update your Wikipedia institutional page — accuracy, sourced citations, and coverage of recent milestones matter
- Audit your institution's online reputation: what does Google, Shiksha, CollegeDunia, and Quora return when someone searches your name?
- Engage with industry and media — recognitions, partnerships, and thought leadership contribute directly to PR
- Identify alumni in senior corporate or academic positions; ensure they're reachable for the NIRF employer survey pool
- Begin DCS data entry at least four weeks before the deadline — not the week before
- Cross-verify all submissions against NAAC, AISHE, and AICTE data; inconsistencies are flagged by the system
- Confirm constituent colleges are submitting in the correct category with the correct affiliation data
- Document everything — NIRF requires supporting evidence for most claims; if it isn't documented, it doesn't count
The Bottom Line
NIRF rewards data accuracy as much as institutional quality. Institutions that consistently rank well aren’t just academically strong — they’re rigorous about documenting and presenting that strength. They have clean Scopus profiles, updated alumni records, verified data submissions, and they start the process months before the deadline, not days before.
You can’t manufacture quality. But you can make sure your genuine quality shows up in every data field.
One last point. Ten per cent of your score is determined by what the outside world finds when they search for you — your Wikipedia presence, your media footprint, how your leadership appears online, what Shiksha and Quora say about your institution. That 10% is a marketing problem as much as an academic one. If that’s where your institution has a visible gap, that’s the specific work we do. It’s worth a conversation.
Deep-dive guides for each parameter:
- NIRF TLR Score: Where Universities Lose Marks and How to Recover Them
- NIRF Research Score (RP): What It Measures and How to Improve It
- NIRF Graduation Outcomes Score: Why Universities Underreport and How to Fix It
- NIRF Outreach & Inclusivity Score: Quickest Wins Available
- NIRF Perception Score: How It’s Calculated
Related reading: